
Tension force and natural frequency of a straight tension bar
This experiment verifies Eq. 15-38 and shows that the force in a tension bar can be predicted using natural frequency measurement.
a) The first mode of vibration b) The second mode of vibration
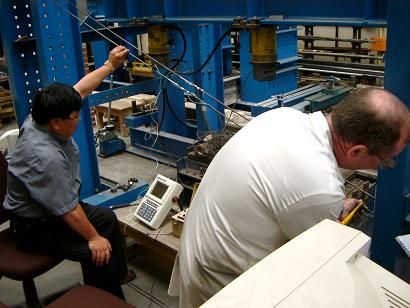
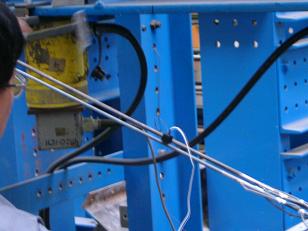
Fig. 15-13: Verification test of a tension bar
Two steel bars with different diameters (6mm and 8mm) and lengths (2.55m and 2.73m) were fixed to the steel frame shown in Fig. 15-13a. Two strain gauges were glued on each of the bars opposite to each other at the mid-points of the bars. Tension forces were applied by through turnbuckles at the ends of the bars, and the values of forces were determined through strain measurements. A small accelerometer was fixed to one of the two bars as shown in Fig.15-13b to record vibrations.
Vibration tests of the tension bars were conducted and accelerations were recorded when the bars were tensioned to different levels. Fundamental natural frequencies were determined from spectral analysis of the acceleration responses. For a range of measured fundamental natural frequencies Table 15-3 compares the measured tension forces in the 6mm tension bar and the forces predicted using Eq. 15-38 where the measured fundamental natural frequency values were taken. For predictions, the following values were used: ![]() ,
, ![]() and
and ![]() .
.
Table 15-3: Comparison of the measured and predicted tension forces for 6mm bar [15.5]
Experimental Results |
Prediction using Eq. 15-38 |
||
Natural frequency (Hz) |
Tension force ( kN ) |
Tension force ( kN ) |
Relative error (%) |
13.9 |
1.16 |
1.16 |
0.00 |
15.5 |
1.42 |
1.39 |
2.11 |
16.9 |
1.70 |
1.65 |
2.94 |
18.3 |
1.98 |
1.93 |
2.53 |
19.6 |
2.25 |
2.22 |
1.33 |
20.5 |
2.50 |
2.43 |
2.80 |
21.9 |
2.77 |
2.77 |
0.00 |
22.8 |
3.05 |
3.00 |
1.67 |
It can be seen from Table 15-3 that the tension forces in a tensioned bar can be predicted using Eq.15-38 and the natural frequency measurements.