
Damping ratio obtained from free vibration tests
The true damping characteristics of typical structural systems are normally very complex and difficult to define with few structures actually behaving as ideal single degree-of-freedom systems. Notwithstanding this, the earlier discussion of single degree-of-freedom systems can be useful when considering more complex practical structures.
A free vibration test was conducted on a full-sized eight-storey test building (Fig. 15-19) to identify the critical damping ratio of its fundamental mode [Ellis, B. R. and Ji, T., (1996)]. In order to amplify the displacements of the structure the building was shaken, by a set of vibrators mounted at the four corners on the roof of the building, at the fundamental frequency of the building. After the vibrators were suddenly stopped, the ensuing free vibrations of the roof of the building were measured. The decay of the vibrations in one of the two main directions of the building is shown in Fig. 15-18. As the excitation caused vibrations effectively only in the fundamental mode, the contributions of other modes of vibration to the decaying response of the structure were negligible.
Table 17-1: Natural frequency and damping ratio determined from various sections of decay
Relative amplitude |
Natural frequency (Hz) |
Damping ratio (%) |
1.00 |
0.611 |
2.87 |
0.366 |
0.636 |
1.81 |
0.181 |
0.645 |
1.28 |
0.106 |
0.647 |
1.02 |
0.062 |
0.656 |
0.85 |
The natural frequency and damping ratio of the response of the structure can be determined from the records shown in Fig. 15-18. Five continuous 10s samples of vibrations were extracted from the response and a curve fitting technique was used to produce smooth curves from which the natural frequency and damping ratio could be determined. One such smoothed curve, superimposed on the measured curve, is shown in Fig. 17-4. The response frequency and damping ratio values extracted from the five samples are given in Table 17-1 and related to the amplitude of vibration at the start of each sample [Ellis, B. R. and Ji, T., (1996)].
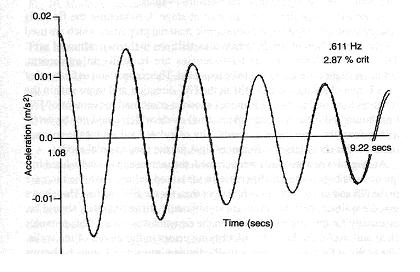
Fig. 17-4: Extraction of natural frequency and damping ratio from free vibration records [Ellis, B. R. and Ji, T., (1996)]
From Table 17-1 it can be observed that:
- the higher the amplitude of vibration, the smaller the natural frequency and the larger the damping ratio,
- the natural frequency for the relative amplitude of 1.00 is 6.86% lower than that for the relative amplitude of 0.062 while the damping ratio at the relative amplitude of 1.00 is 238% higher than that at the relative amplitude of 0.062.
When the building vibrated with small amplitudes, the relative movements between joints and other connections in the structure were small involving frictional forces doing less work leading to lower damping ratios than were found when amplitudes were larger with associated larger relative joint movements and friction related work. These variations have been observed in many different types of structure.