The effect of stationary spectators on a grandstand
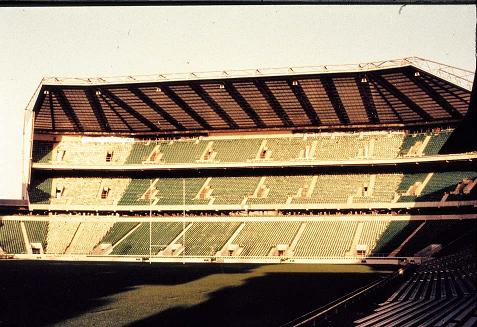
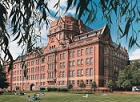
Fig. 19-10: The North Stand, Twickenham
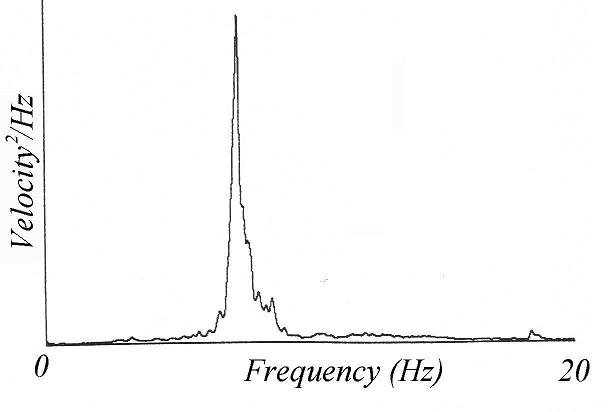
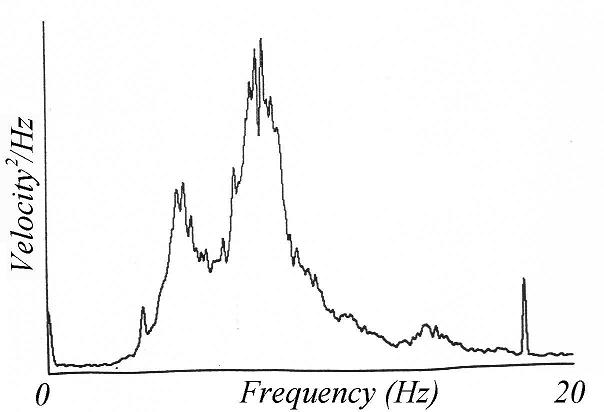
a) Without spectators b) With spectators
Fig. 19-11: Response spectra of the North Stand, Twickenham
Measurements were taken to determine the dynamic behaviour of the North Stand (Fig. 19-10) at the Rugby Football Union ground at Twickenham. The grandstand has three tiers and two of them are cantilevered. Dynamic tests were performed on the roof and cantilevered tiers of the stand, with further measurements of the response of the middle-cantilevered tier to dynamic loads induced by spectators during a rugby match [19.2].
Spectra for the empty and full grandstand are given in Fig 19-11. Fig. 19-11a shows a clearly defined fundamental mode of vibration for the empty structure. Instead of the expected reduction in natural frequency of the stand as the crowd assembled, the presence of the spectators appeared to result in the single natural frequency changing into a two natural frequencies (Fig. 19-11b). Fig. 19-11 shows that the dynamic characteristics of the grandstand changed significantly when a crowd was involved and that the structure and the crowd interacted. This pattern was also noted in two other locations of the stand where measurements were taken.
Comparing the spectra for the empty stand and fully occupied stand, three significant phenomena are apparent:
- an additional frequency was observed in the occupied stand.
- the natural frequency of the empty stand is between the two natural frequencies of the occupied stand.
- the damping increases significantly when people were presented.
Considering human bodies simply as masses cannot explain the above observations. The observations suggest that the crowd acted as a mass-spring-damper rather than just as a mass. When the crowd is modelled as a single degree-of-freedom system, the structure and the crowd form a two-degree-of-freedom system. Based on this model, the above observations can be explained. These observations complement the laboratory tests described in Section 19.3.