
Lateral buckling of beams
This set of models demonstrates the behaviour of lateral buckling of a narrow rectangular beam with different sizes of section and thus the validity of Eq. 10-8.
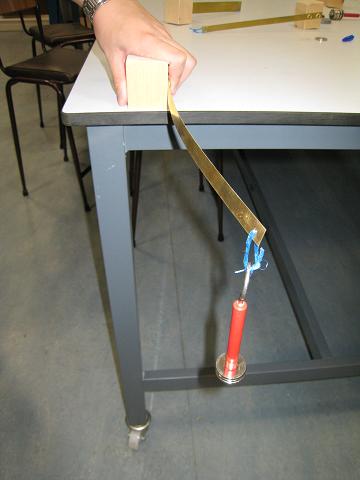
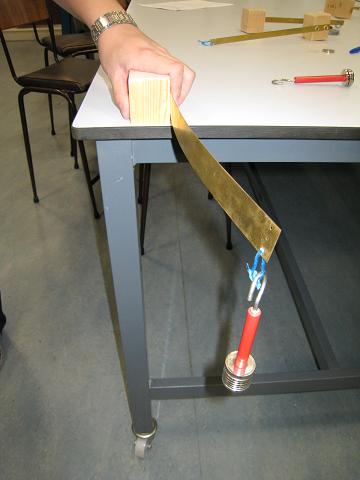
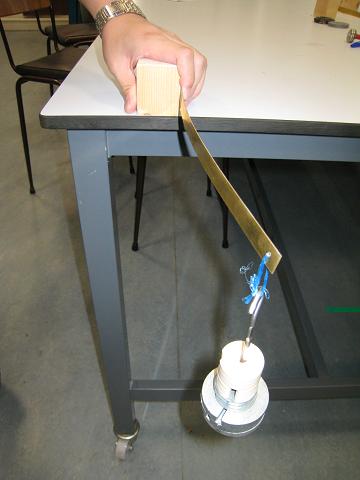
Fig. 10-7: Lateral torsional buckling behaviour
The buckling behaviour of the three brass cantilevers described in Example 10-1 is demonstrated through simple tests. One end of each of the brass strips is fixed to a wooden block through screws, creating cantilevers as shown in Fig. 10-7.
Model A: 270 mm long cantilever with a 12.7 mm x 0.397 mm rectangular cross-section
Hold one end of the cantilever (Fig. 10-7a) firmly and apply a vertical concentrated load at the free end. Increase the load gradually until the beam moves sideways and twists (when the loading is about 0.49N). This type of deformation typifies the form of instability called lateral torsional buckling.
Model B: 270 mm long cantilever with a 25.4 mm x 0.397 mm rectangular cross-section
The effect of increasing the height of the section: repeat the type of test carried out for Model A. When the concentrated load reaches approximately 0.98N, the cantilever starts to move sideways and twist (Fig. 10-7b). This value is twice that of the critical load for Model A. As predicted by Eq. 10-8 doubling the height of the narrow beam doubles the buckling moment or the critical load.
Model C: 270 mm long cantilever with a 12.7 mm x 0.794 mm rectangular cross-section
The effect of increasing the width of the section: repeat the type of test carried out for Models A and B. When the concentrated load reaches approximately 3.82N, the cantilever starts to move sideways and twist (Fig. 10-7c). The load is now nearly eight times that which caused lateral torsional buckling of Model A. It is about four times that which caused lateral torsional buckling of Model B although the cantilever uses the same amount of material as Model B. Following Eq. 10-8, the buckling load of Model C should be exactly eight times that of Model A and four times that of Model B.
Model D: Model A with a lateral support
The effect of lateral restraint: repeat the type of test carried out for Model A but this time hold the cantilever at mid-span using a finger and thumb to prevent lateral movement. The loading can increase significantly without lateral buckling. This indicates that the lateral restraint effectively increases the lateral torsional buckling capacity of the cantilever.
Table 10-3: Comparison between the calculated and measured lateral buckling loads
Boundary conditions |
Model A |
Model B |
Model C |
Theoretical critical load ( N ) |
0.462 |
0.924 |
3.70 |
Relative theorectical critical load |
1 |
2 |
8 |
Test critical load ( N ) |
0.49 |
0.98 |
3.83 |
Relative test critical load |
1 |
2 |
7.8 |